Steel Decarbonization Dynamics Service (SDDS)

Answer to Test your Steel Decarbonization Question:

The correct answer is C: 5-15 kg/ton of crude steel.
Coal (sometimes coke) is injected as a supplemental  energy source and to form foamy slag to capture impurities and maintain heat. Coal provides up to 40% of total EAF energy requirements and accounts for 40%-70% of direct CO2 emissions. There are multiple efforts around the globe aimed at replacing EAF coal with biochar including Steel Dynamic’s joint venture in Columbus, Mississippi.

Sources

Insights into the Steel Industry’s carbon conundrum

The Steel Decarbonization Dynamics Service (SDDS) is a comprehensive information package focused on the global steel industry’s decarbonization challenge that consists of analyses, forecasts and customizable models with an outlook to 2030, 2040 and beyond.  It differs from the ever-increasing number of steel industry decarbonization reports in three key ways:

  • Our Reports focus not on what could happen or what needs to happen, but rather on what is likely to happen…and
  • Our proprietary model provides a holistic assessment of CO2 emissions, cost structures, raw materials balances, and energy requirements
  • The Service offers the opportunity for the user to create customized scenarios by manipulating hundreds of inputs (country/region/plant-specific)

SDDS continues WSD’s decades-long history of providing rigorous, independent, and often controversial analyses and opinions.

REQUEST SAMPLE REPORT

WSD is available for customized presentation, consultation with your Board of Directors, Management Team, etc.  Schedule a call today for more information


POWERED BY PROPRIETARY MODEL

  • SDDS’ analyses and forecasts are powered by WSD’s Steel Industry Decarbonization and Cost Model which encompasses industry CO2 emissions, cost structures, raw material usage and energy requirements as a function of step-change technology deployments, incremental operating practice changes, and market dynamics.  The Model quantifies the inter-dependencies among these factors and highlights their trade-offs: e.g., costs versus emissions based on changes in operating practices, fuel mix, burden, etc.

1. Semi-annual Reports featuring WSD’s analyses and forecasts

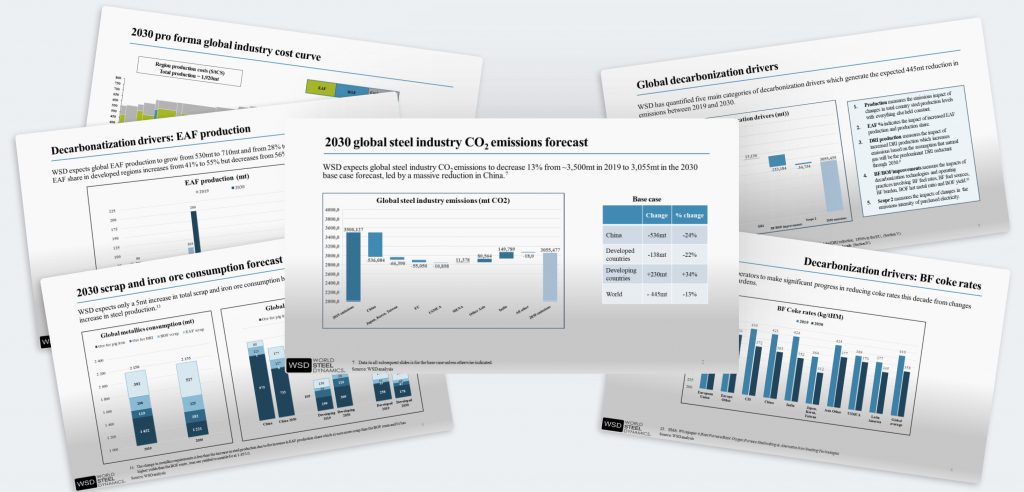
The SDDS Reports feature extensive analyses and a comprehensive set of forecasts of the industry carbon emissions, technology configurations, cost structures, raw materials consumption, and energy requirements. The Report includes over 75 tables and charts which summarize the country, region and global forecasts.

WSD has supplemented its extensive in-house knowledge through conversations with steel producers, technology equipment suppliers and technical experts

A unique feature of WSD’s forecast approach is the delineation of six critical steel industry decarbonization drivers starting at the country level:

  • Steel production level
  • Equipment configuration, DRI usage and CO2 intensities based on reductant mix
  • BF/BOF operational changes in fuel rates, fuel mixes, burden mixes, BOF hot metal ratio and yield
  • Electricity grid CO2 intensity
  • Carbon capture (CCUS) rate

OVER 130 DATA PARAMETERS

2. Data Package

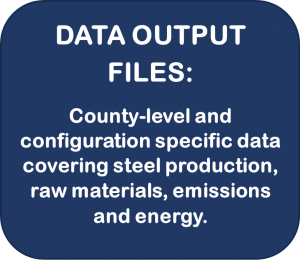
As a supplement to the Reports, SDDS includes a data package (delivered to you in an excel file that is updated several times per year) which contains the detailed country level figures underpinning our Reports.

The Data Package covers 42 countries and 11 regions, with over 130 parameters including:

  • Steel production
    • country totals by configuration
  • CO2 emissions and emissions intensity (CO2 kg/tCS)
    • by configuration production stage
    • country totals by configuration
    • by factor input: e.g., proportion of EAF crude steel emissions attributable to charged DRI (which in turn is based on reductant mix)
  • Raw materials consumption and usage rate (tons/ton)
    • per type: home scrap, external scrap, iron ore lump, fines, pellets
    • by configuration production stage
    • country totals by configuration
  • Fuel/energy usage and usage rates (kg/tHM, kg/tDRI)
    • per type PCI, coke, green/blue/grey hydrogen, biomass, etc.
    • by configuration production stage
    • country totals by configuration
Sample Data Output:  Click to download

CUSTOMIZED SCENARIOS


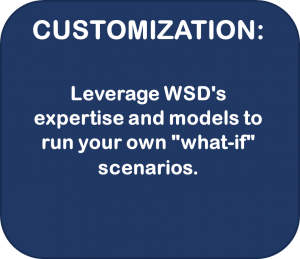
3. Customization:

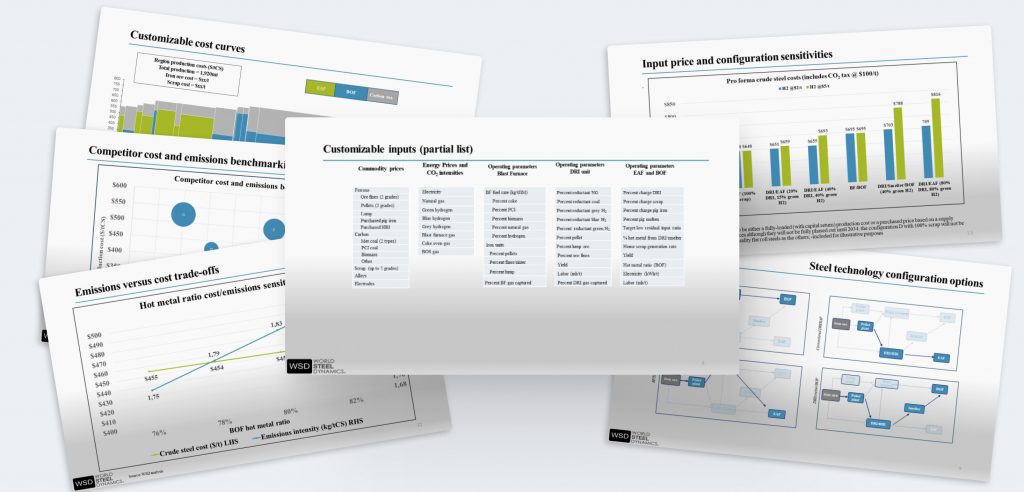
The SDDS Reports feature WSD’s expert analyses and forecasts for technology development, raw materials, energy and costs. WSD can produce alternate scenarios based on a client’s specific objectives and assumptions by country, region and globally. The Model generates the same detailed integrated outputs as seen in the Reports and data packages. The Model can also be used to generate plant-level competitor benchmarking assessments.

Examples of how the customization capabilities can be used include:

  • Alternative industry cost curves under different input cost and carbon tax assumptions
  • Impacts of different technology adoption rates for EAF production, DRI production, carbon capture (CCUS), hydrogen use in blast furnaces, etc.
  • Costs, emissions, raw materials and energy requirements comparisons of different configurations including BF/BOF, BF/EAF, DRI/smelter/BOF, and EAF/scrap & DRI
  • Cost versus emissions trade-offs, such as the impact of increasing or decreasing BOF hot metal ratios or DRI charge rates
  • Value in use analyses, such as the comparison of BF and DRI grade pellets in DRI/smelter configurations
  • Competitor plant benchmarking, e.g., costs and emissions


DECARBONIZATION PROJECTS DATABASE


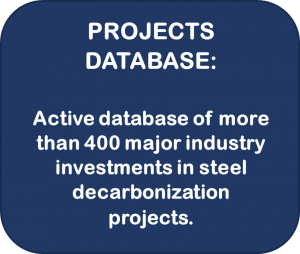
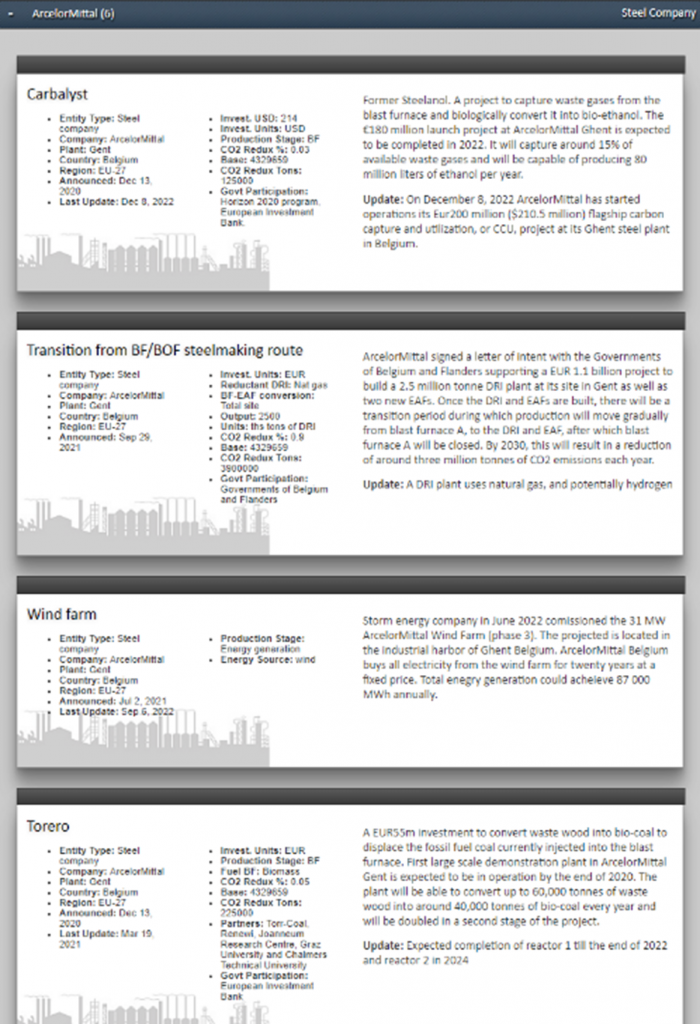
SDDS includes an active database of major industry investments in steel decarbonization projects. This is updated monthly and delivered via an online portal available on our Global Steel Intelligence System (GSIS). The database covers:

  • Steel producer CO2 reduction projects and initiatives tracked by technology type, including direct emissions reduction, carbon capture, hydrogen-based iron making, carbon recycling into steel products, and green energy sources
  • Extensive details on each project including maturity level, investment costs, targeted emissions reductions, technology suppliers, partnerships with other entities, launch dates and updates (as available)
  • Other company and industry initiatives
  • Key actions by mining companies, industry associations, and governments

For More Info

Request Sample